Win/Loss Analysis
Post-deal analysis at a previous company was a quarterly event covering 30% of deals — the rest disappeared into HubSpot with no structure and no follow-up.
Date
June 2026
Role
AI Automation Designer
Company
Freelance
Stack
n8n · HubSpot · Claude AI
Build Time
1 day
Key Outcome
How one day of automation replaced months of quarterly reviews that covered 30% of deals
A one-day build that replaced months of incomplete quarterly reviews with automatic, structured intelligence on every single deal that closes.
Background
This was not a portfolio exercise. It was a solution to a problem I watched go unsolved for months.
At a previous company, the sales team closed deals at a reasonable rate but had almost no structured understanding of why. Every quarter, leadership would ask for a win/loss breakdown. Every quarter, someone would manually review HubSpot, pull deal notes, and produce a slide deck that took two days to compile and was outdated by the time anyone read it.
The real failure wasn't the time cost — it was the inconsistency. Some deals got detailed post-mortems. Most got nothing. The team knew their win rate. They had almost no idea why it was what it was. Pattern recognition — the kind that changes how a sales team operates — was impossible without consistent data collection across every single deal.
"We had a quarterly win/loss review that took two days to prepare and covered maybe 30% of deals. What we needed was a system that covered 100% of deals automatically and surfaced patterns we weren't looking for."
The Problem
Four specific failure modes that made post-deal analysis useless in practice.
Failure mode 01 — Analysis happened quarterly, not per deal
By the time win/loss analysis ran, deal context had faded. Reps couldn't remember specifics. Call notes were incomplete. The insights produced were generalisations, not diagnosis.
Failure mode 02 — Coverage was selective, not complete
Big deals got reviewed. Small deals got nothing. Enterprise losses triggered post-mortems. SMB losses disappeared. The sample was biased toward deals people already had opinions about.
Failure mode 03 — Output was unstructured
Post-deal notes lived in HubSpot fields, Slack messages, and email threads — none of it in a consistent format. Comparing deal outcomes across quarters was a manual reconciliation exercise.
Failure mode 04 — Patterns were invisible
Without consistent per-deal data, pattern recognition was impossible. The insight that "we lose enterprise deals when procurement gets involved before the economic buyer" requires seeing it across 10+ deals — which requires having captured it in 10+ deals.
How It Works
Five tools, one trigger, zero manual steps — fires on every closed deal without exception.
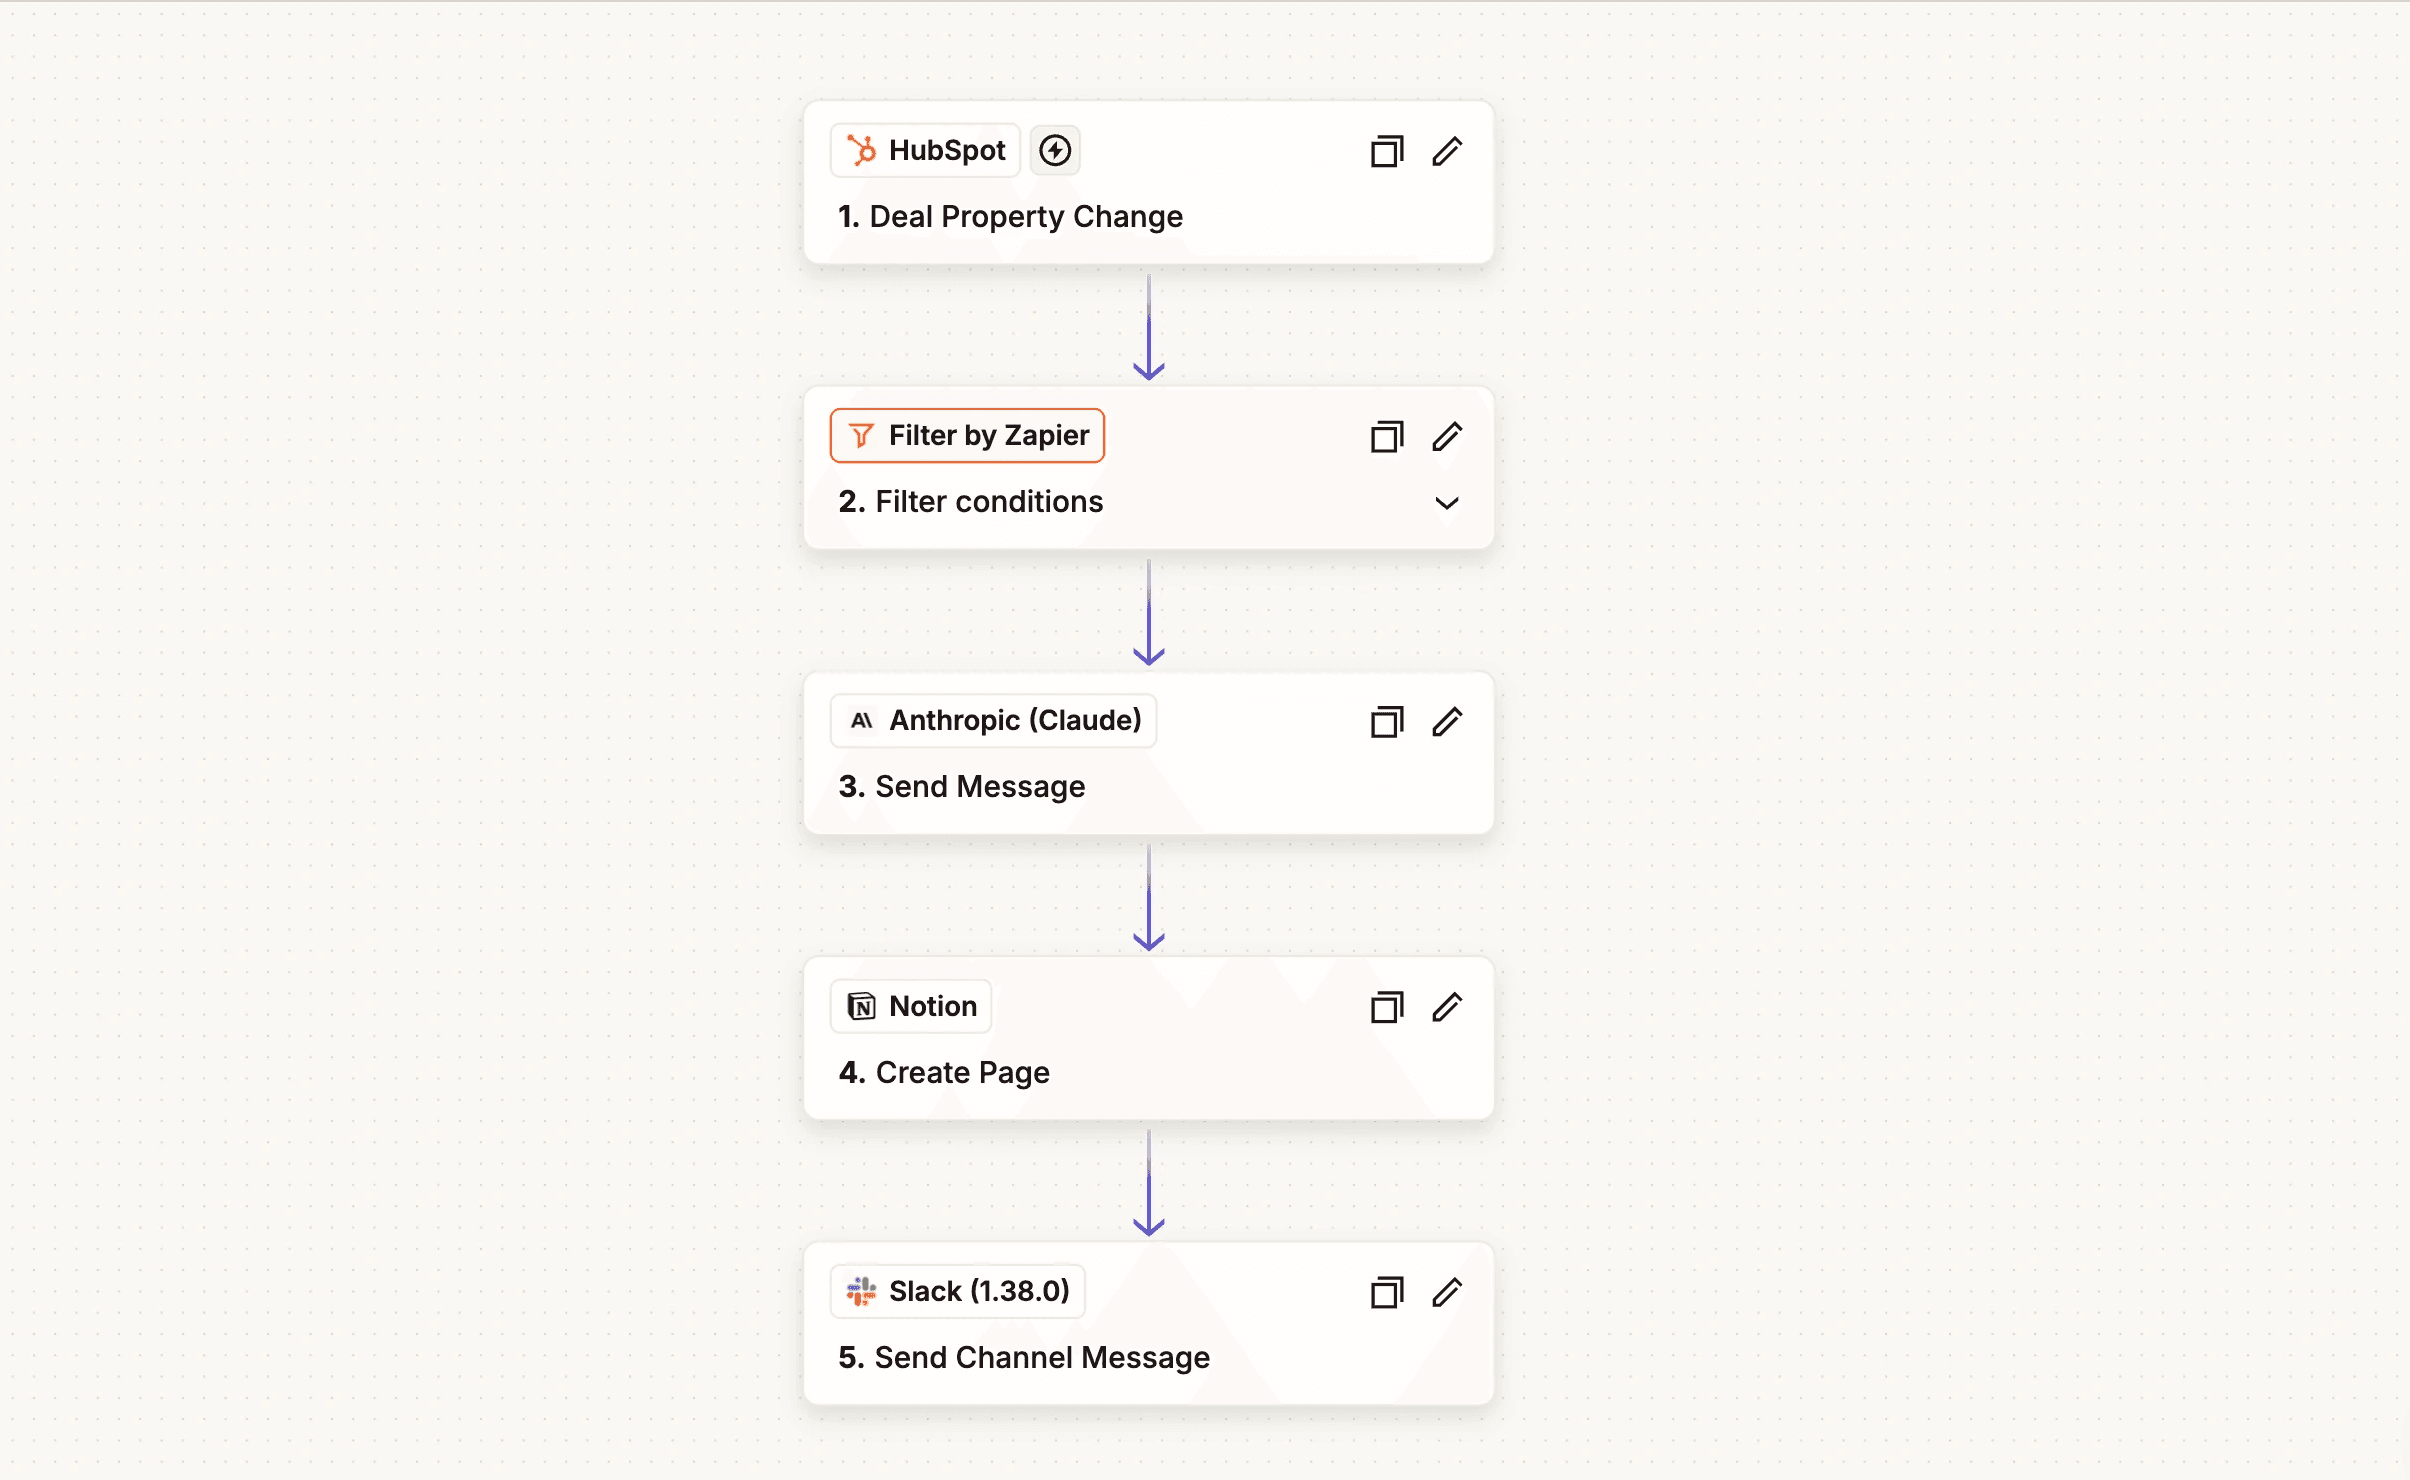
The automation fires the moment a deal stage changes to Closed Won or Closed Lost in HubSpot. Zapier fetches the full deal record, structures it into a prompt, sends it to Claude AI, and routes the output to both Notion and Slack simultaneously. The entire pipeline completes in under two minutes from trigger to delivery.
HubSpot trigger — Deal stage changes to Closed Won or Closed Lost → Zap fires instantly. No polling delay, no manual activation.
Full deal data fetch — Zapier pulls the complete deal record: deal name, value, close date, associated contact and company, deal source, pipeline stage history, call notes, and any logged activity.
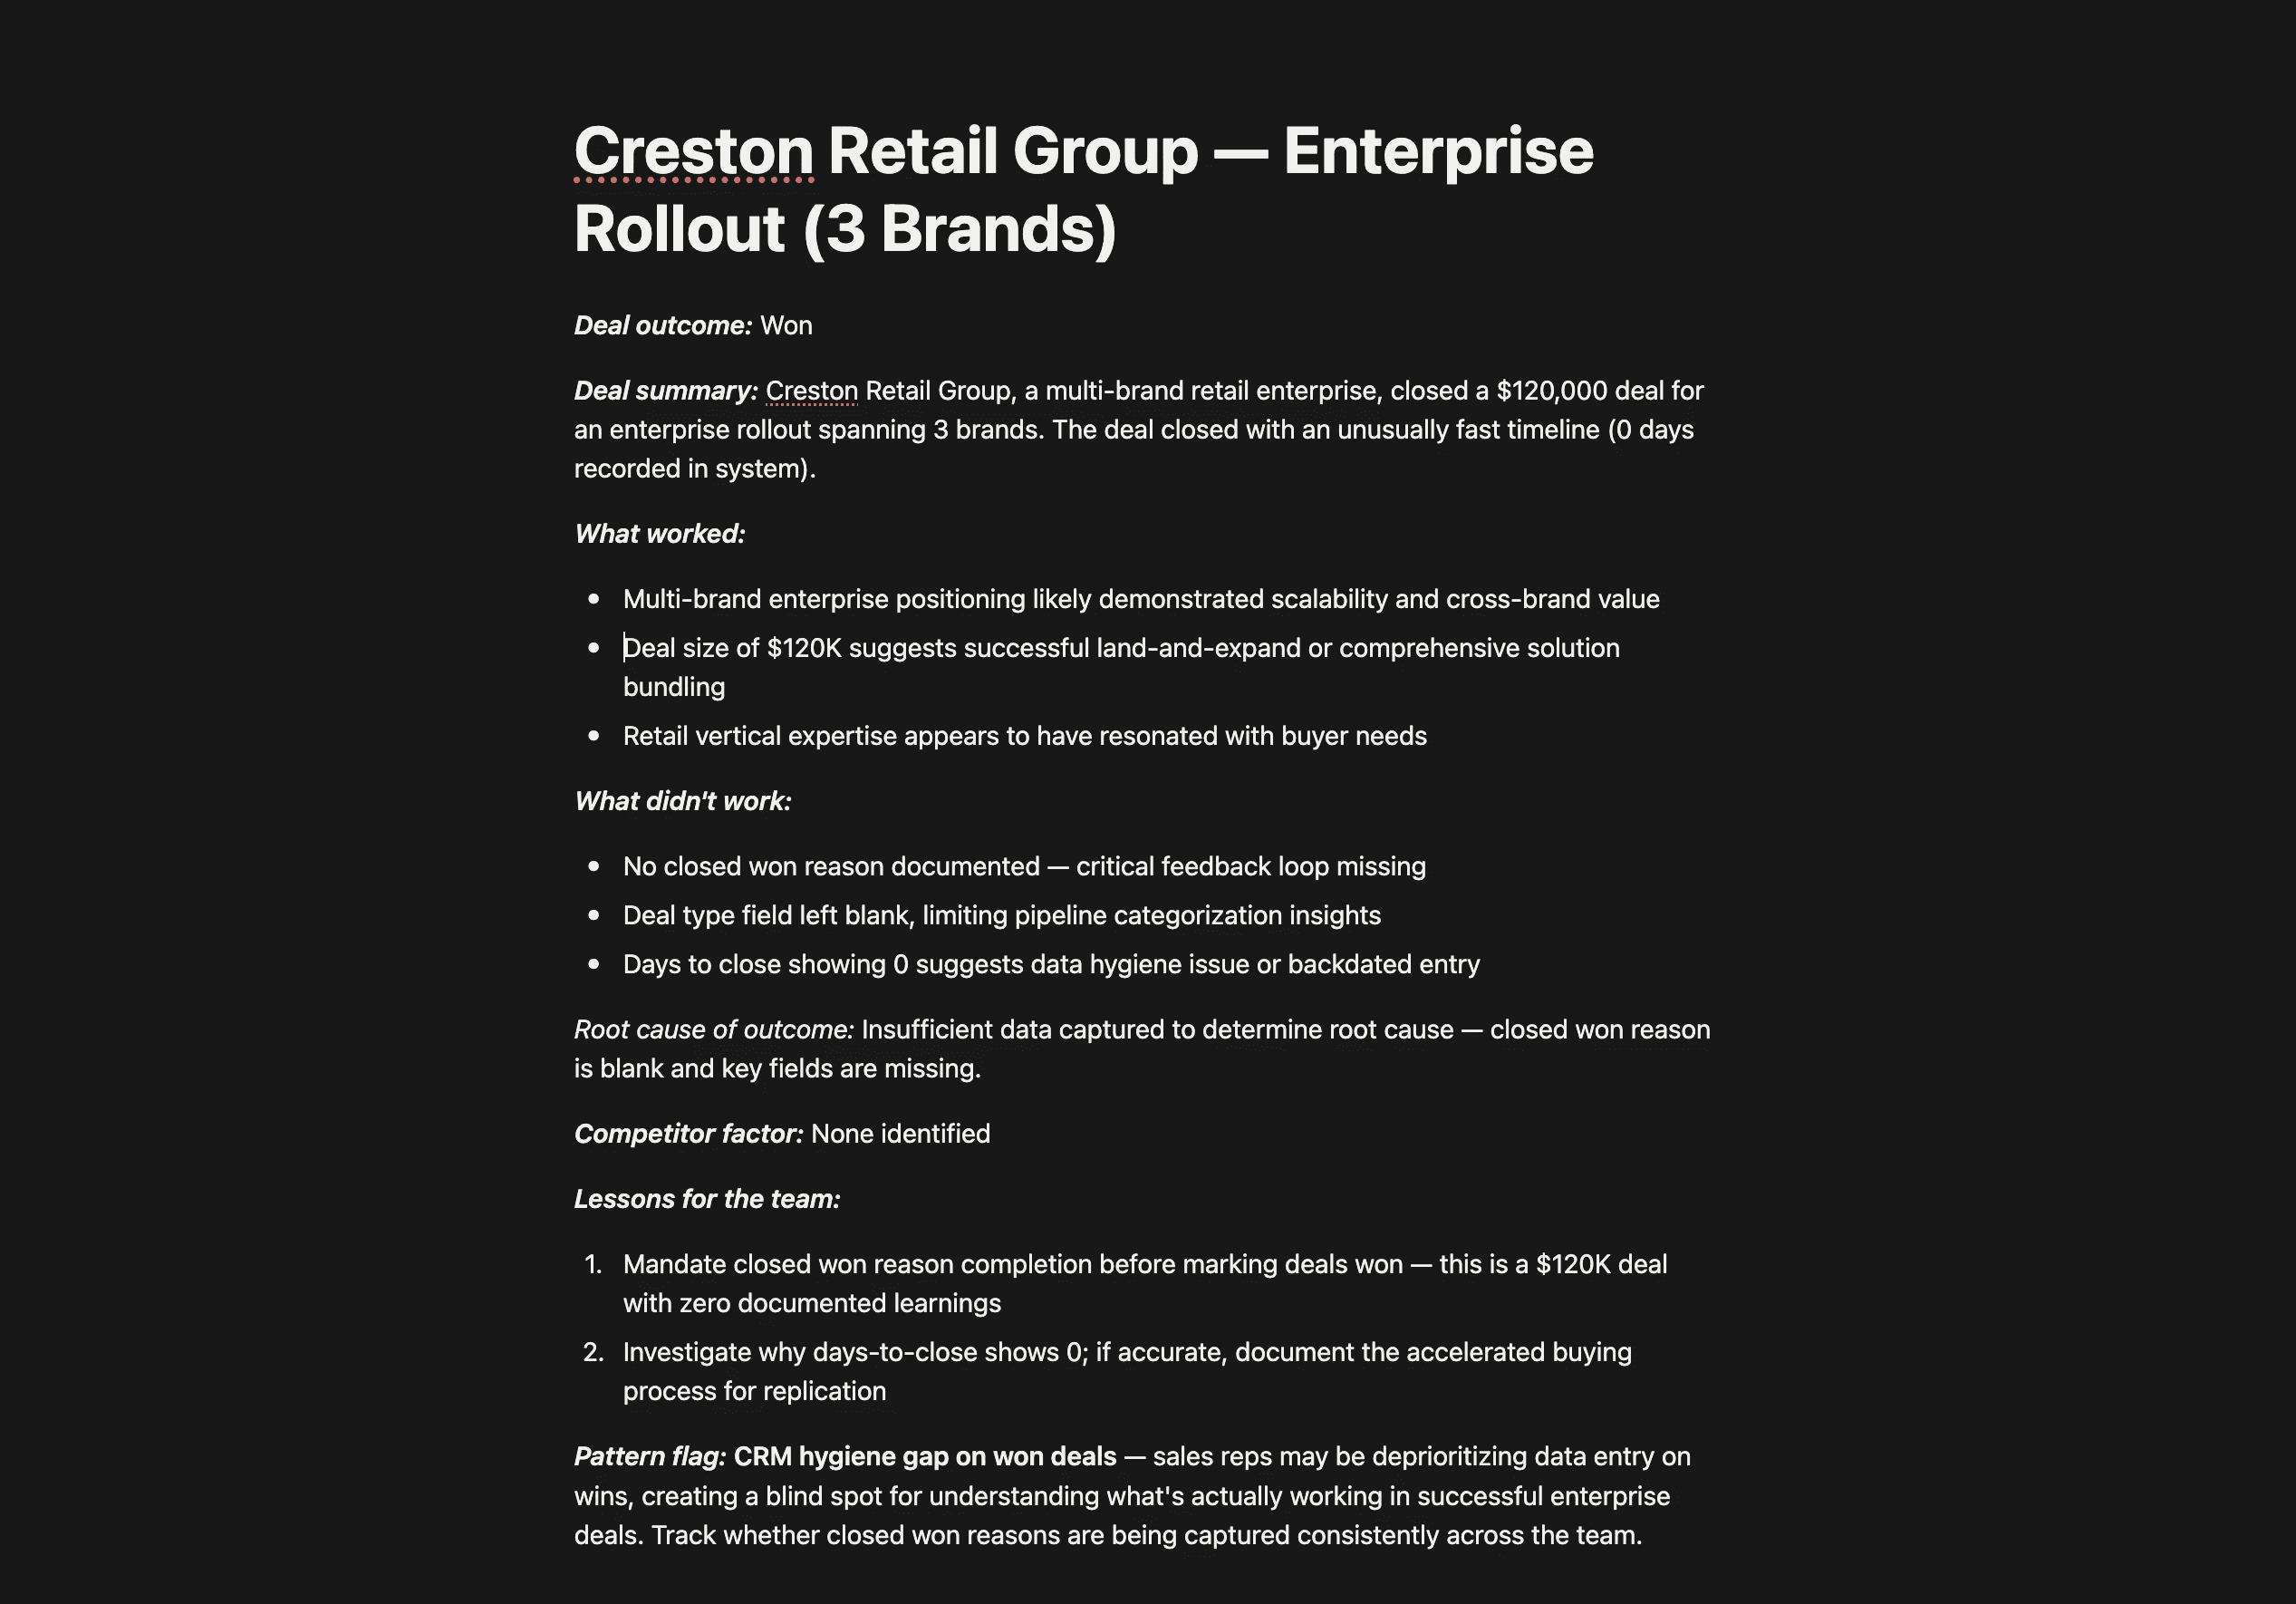
Claude AI analysis — Structured prompt sent to Claude with the full deal context. Returns a six-section post-deal intelligence report.
Notion report created — Full report auto-populated into a new Notion page in the Win/Loss database — structured, tagged by outcome (Won/Lost), searchable, and permanently archived.
Slack summary posted — A condensed digest posted to the leadership Slack channel instantly — deal name, outcome, one-sentence root cause, and the most significant pattern flag. Readable in 15 seconds.
Prompt engineering
The v1 prompt produced summaries. The final prompt produces intelligence.
The first version of the Claude prompt was a straightforward instruction: summarise this deal data and explain why it was won or lost. The output was readable but shallow — it restated what was in the deal notes rather than analyzing them. It described; it didn't diagnose.
The prompt went through three iterations before the output quality reached the bar where it was genuinely useful as sales intelligence rather than just a neater version of the deal record.
v1 prompt — rejected
"Summarise this deal. Explain why it was won or lost based on the notes provided."
Problem: produced descriptive summaries that restated the deal notes. No root cause analysis, no pattern flags, no actionable output. Useful as a record, useless as intelligence.
v2 prompt — improved
"Analyse this deal across: what worked, what didn't, root cause, competitor factor, team lessons."
Problem: better structure, but each section still described rather than diagnosed. "Root cause" responses were surface-level. No instruction to connect this deal to broader patterns.
Final prompt — shipped
"You are a senior revenue analyst. Given this deal data, produce a structured post-deal analysis. For each section, diagnose — don't describe. In the pattern flags section, identify what this deal has in common with the patterns that typically explain wins or losses at this deal size and stage. Be specific and direct."
Result: output shifted from description to diagnosis. Root cause responses became specific and actionable. Pattern flags started surfacing genuinely useful observations across deal types.
Report structure
Six sections — each designed to answer a different question that matters to a sales team:
What worked — factors that contributed positively — what to replicate
What didn't — friction points, objections, and process failures — what to fix
Root cause — the single underlying reason the deal went the way it did
Competitor factor — whether and how competitive dynamics shaped the outcome
Team lessons — specific, actionable learnings the team can use on the next deal
Pattern flags — what this deal shares with a broader pattern across the pipeline
85%
of deals analyzed
2 hrs
saved per deal
1 day
to build & deploy
Outcomes & Impact
1–2 hrs saved per deal — zero manual analysis required
100% deal coverage — every close captured without exception
1 day build time — designed, configured, tested, and deployed
Reflections & What Comes Next
The build was fast. The prompt iteration was not.
The Zapier workflow took a few hours to build and test. The prompt iteration took longer — going from a v1 that described deals to a final version that diagnosed them required understanding what "useful sales intelligence" actually means in practice, and then encoding that understanding into a prompt that produced it consistently.
The most important insight from the build: the value of this automation is not in any individual report. It is in the accumulation. Each report is moderately useful. One hundred reports, properly tagged and searchable in Notion, is a competitive intelligence asset. The system is worth more the longer it runs — which is exactly what good automation should be.
Check Out the Live Product

Note: Internal automation — available on request
Ein Marken- und Produktdesigner, der sich darauf konzentriert, bezaubernde digitale Erlebnisse zu schaffen